670,000 plate appearances, a negative binomial, and the most useful failure I've shipped.
I lost money betting on baseball.
Not a catastrophic amount, but enough that I stopped telling my roommates about it, and enough that the stubborn part of my brain refused to let it go. I don't hate losing money. I hate losing money to randomness I could have modeled. So I did the thing every stats undergrad does when they get annoyed: I decided to build a model.
The plan was simple. Predict the total runs in a game better than the sportsbook, find the gaps, print money. You can already tell from the title how that went.
Here's what actually happened, why it's more interesting than a win would have been, and everything I'd tell you if you were about to try the same thing.
The number nobody wants to hear first
Before I wrote a line of modeling code, I did one calculation that should have talked me out of the whole project. I'm glad I ran it now, because it reframed everything.
How predictable is a baseball game, at best?
I simulated it. Take realistic spreads for how much teams differ in offense, pitching, and ballpark, and ask: if you knew all of that perfectly, how much of a game's final total could you explain? The answer is about 9%.
Ninety-one percent of a baseball game is noise. Bloops that fall in. Rockets hit straight at fielders. A checked-swing single in the ninth. The stuff no model can touch because it isn't a function of anything knowable beforehand.
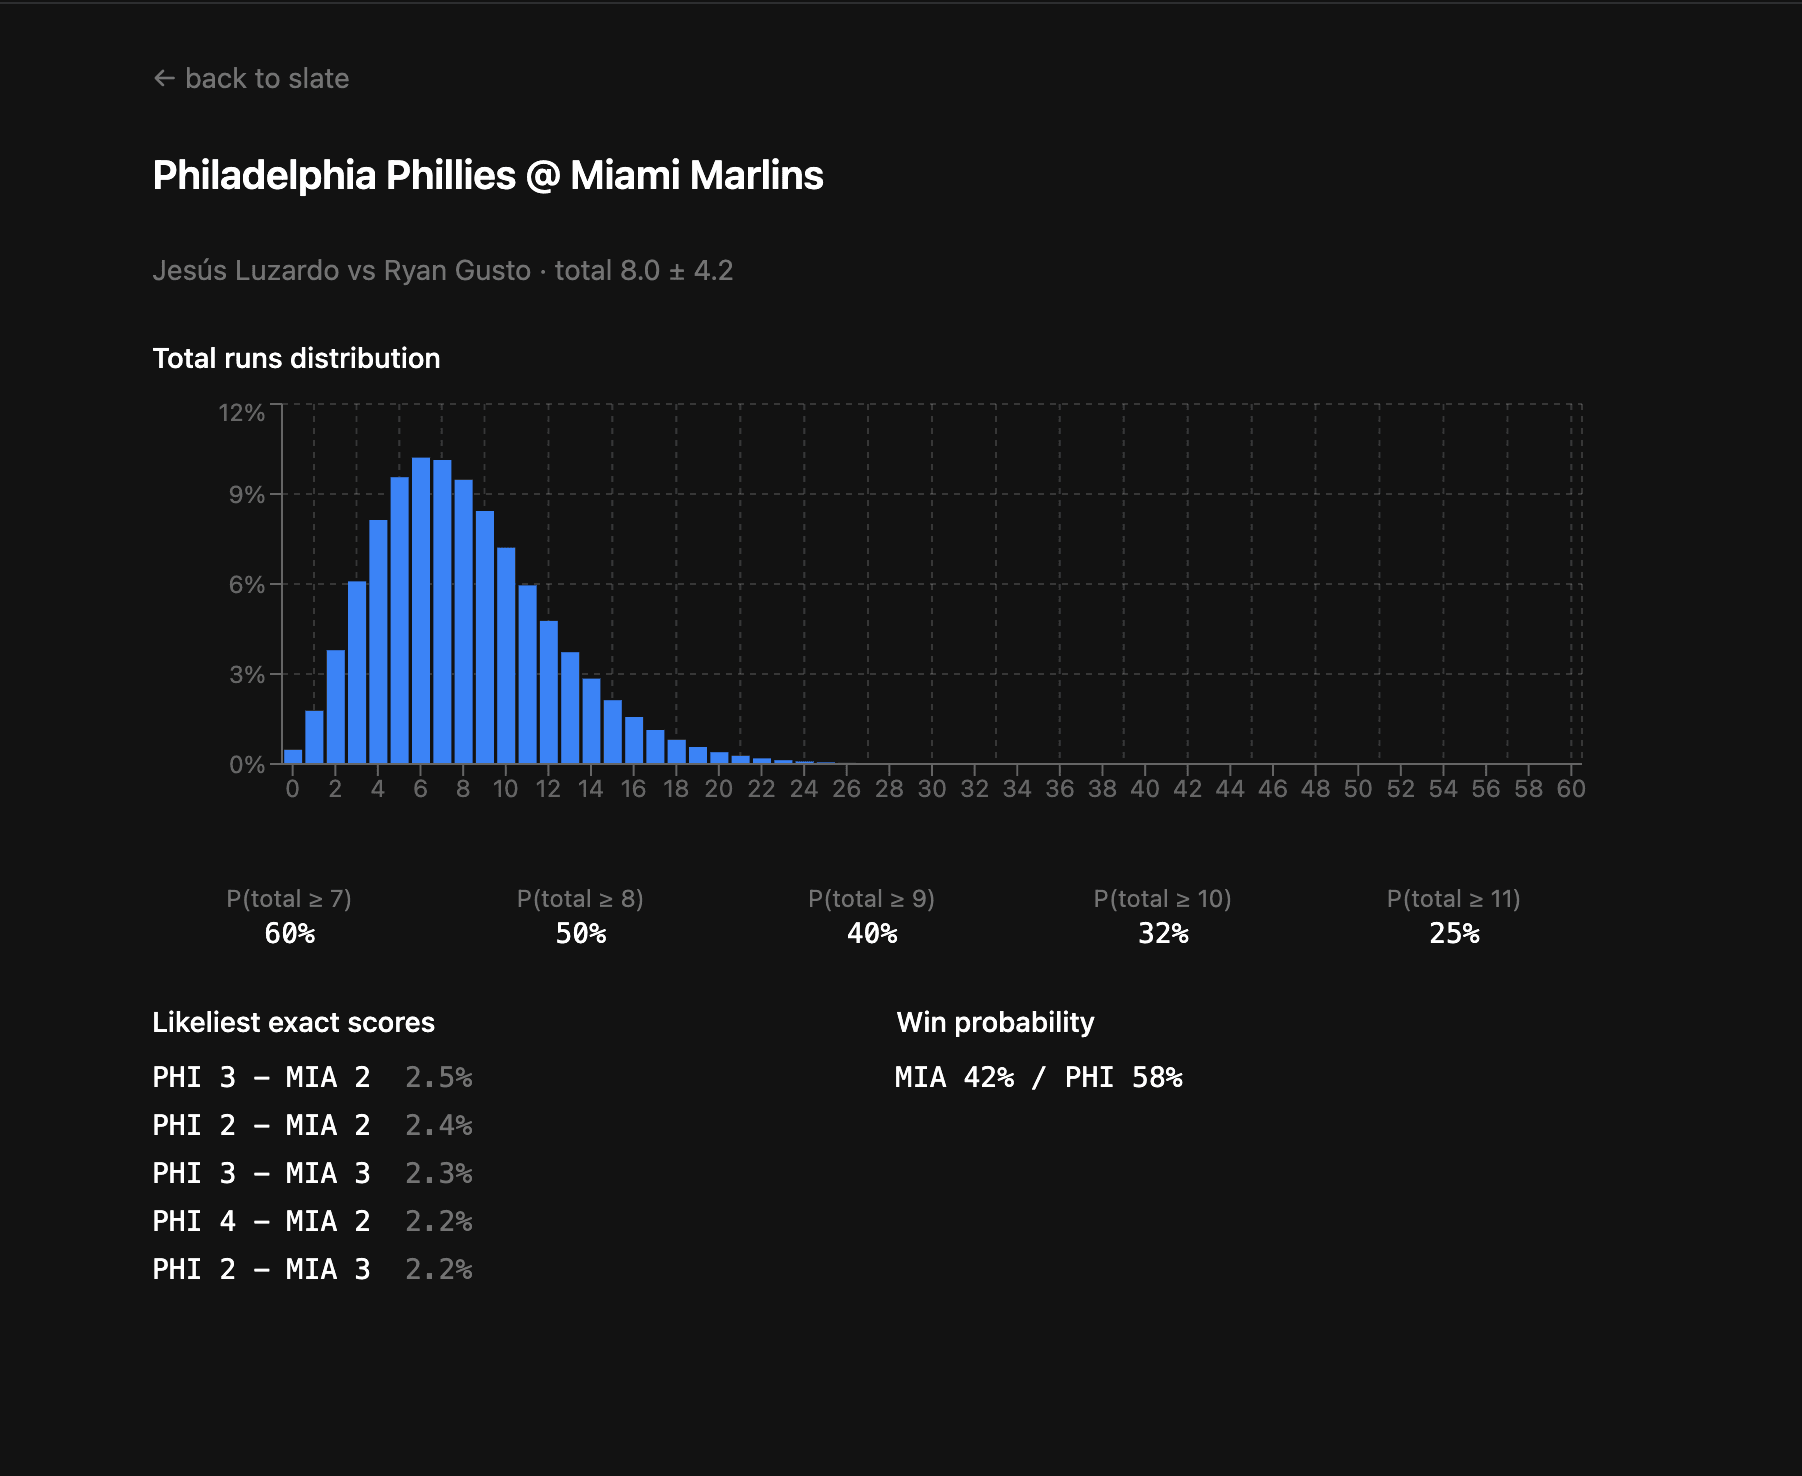
That number does something important: it changes what “good” means. If you chase point accuracy, insisting the total will be 8.7, you will look like a failure no matter how good your model is, because you'll be off by three runs on average and so will God's own model. So I stopped trying to predict the score. I aimed for something achievable instead: calibration. When my model says there's a 60% chance the game goes over 8.5, it should go over about 60% of the time. You can't predict the score. You can predict the odds.
That reframe is the single most useful thing in this whole post. Hold onto it.
What the model actually looks at
A baseball game's run total comes down to a small number of things, and I wanted the model to use the honest version of each.
How well a team hits, measured by process rather than luck. The naive move is to rate offense by runs scored. The problem: runs are contaminated by sequencing and luck. Three singles in one inning score a run; the same three singles spread across three innings score nothing. A 105-mph line drive right at the shortstop is an out; a 60-mph bloop that drops is a hit. Runs reward the bloop and punish the rocket, which is exactly backwards if you're trying to predict the future.
So instead of runs, the model uses xwOBA, expected weighted on-base average. It grades each plate appearance by how hard and at what angle the ball was hit, then asks how often balls hit like that become hits historically. The rocket-at-the-shortstop gets credited as the good swing it was. The lucky bloop gets little. It measures what a team did, stripped of what luck did to them, and it predicts future scoring better than past scoring does.
The pitching, starter and bullpen, rated separately by FIP, which is built only from what a pitcher controls (strikeouts, walks, home runs) and ignores the defense behind him. Starter and bullpen are split apart and weighted by how long the starter is expected to last, because “the pitching” is really two different pitching staffs having two different nights.
The ballpark. Coors Field inflates scoring; pitcher-friendly parks knock it down. A simple multiplier.
The era. Leaguewide scoring drifts season to season, since the ball itself changes. A rolling league-average term keeps the model anchored to the current run environment instead of assuming baseball scores the same forever.
The part that separates real models from fake ones
Here's where most “I beat Vegas” projects quietly fall apart, and where I spent the majority of my effort.
You are not allowed to use the future.
It sounds obvious. It is not obvious in practice, because the trap is invisible. A team's season-long xwOBA is sitting right there in the data, and it's the natural number to grab. But if I use the Yankees' full-2026 xwOBA to predict their game on July 27, I've cheated: that season average already contains July 27, and every game after it. I'd be using the answer to predict the answer.
This is called data leakage, and it's the number one way sports and finance modelers fool themselves. Nothing errors out. The code runs clean. The model produces gorgeous accuracy, then falls apart the instant you point it at a genuinely upcoming game, because for a real future game, that “future” data doesn't exist yet.
So every single input in my model is computed using only games played before the one being predicted. To rate the Yankees for July 27, I use their games through July 26 and not one pitch more. That's exactly the information I'd have if I were making the bet live.
And I didn't just trust myself to get it right. I wrote a test that actively tries to cheat and confirms it can't. It takes a game, alters data from the future, and checks that none of the model's inputs for that game move. If a game that hasn't happened yet could change a past prediction, the test fails loudly. It passed.
My favorite piece of accidental proof: the model can only correctly predict 18 of the 700 short starts in my data. That sounds bad. It's actually the system working. A model peeking at the future would “predict” all 700 perfectly, because it'd already know they happened. Mine can't foresee an ejection or a blowup. It only knows a pitcher's prior workload, so it flags exactly the handful of recurring openers and nothing else. The model being appropriately unable to see the future is the proof it isn't cheating.
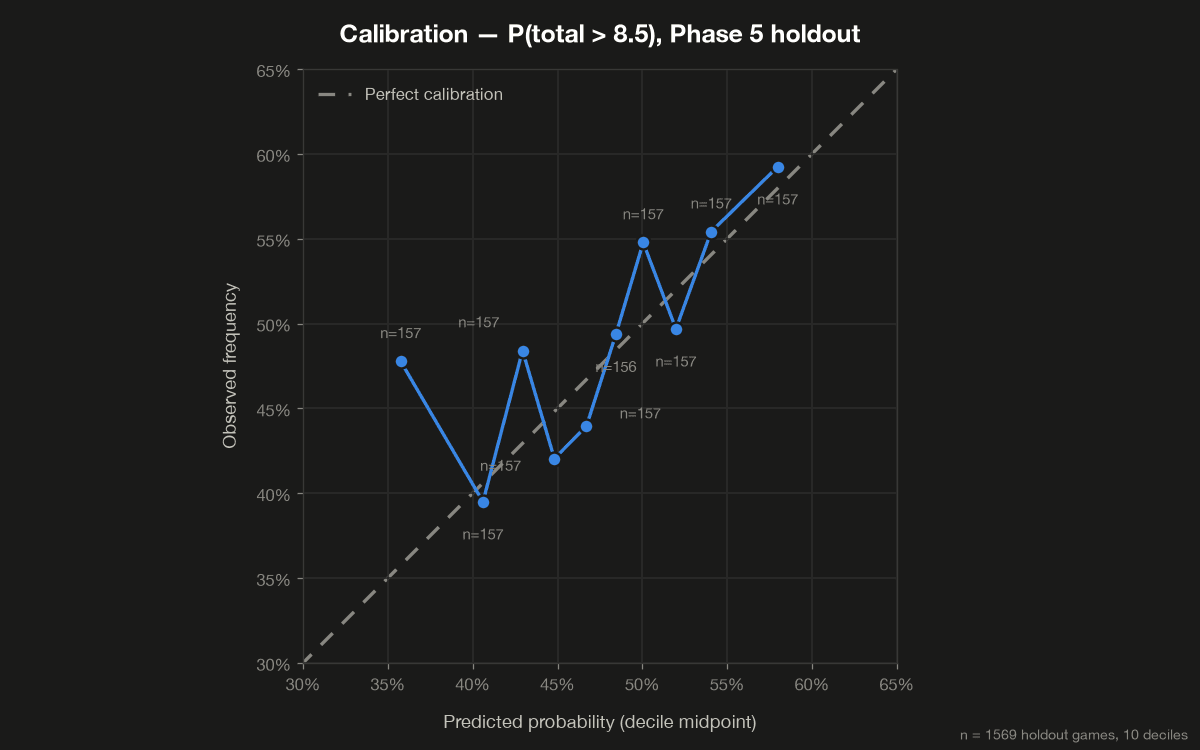
The cheat-test proves the plumbing doesn't leak. The next chart proves the output is honest too: the probabilities coming out the other end mean what they say, on 1,569 holdout games the model never trained on.
The plot twist: I was sure it was too cautious
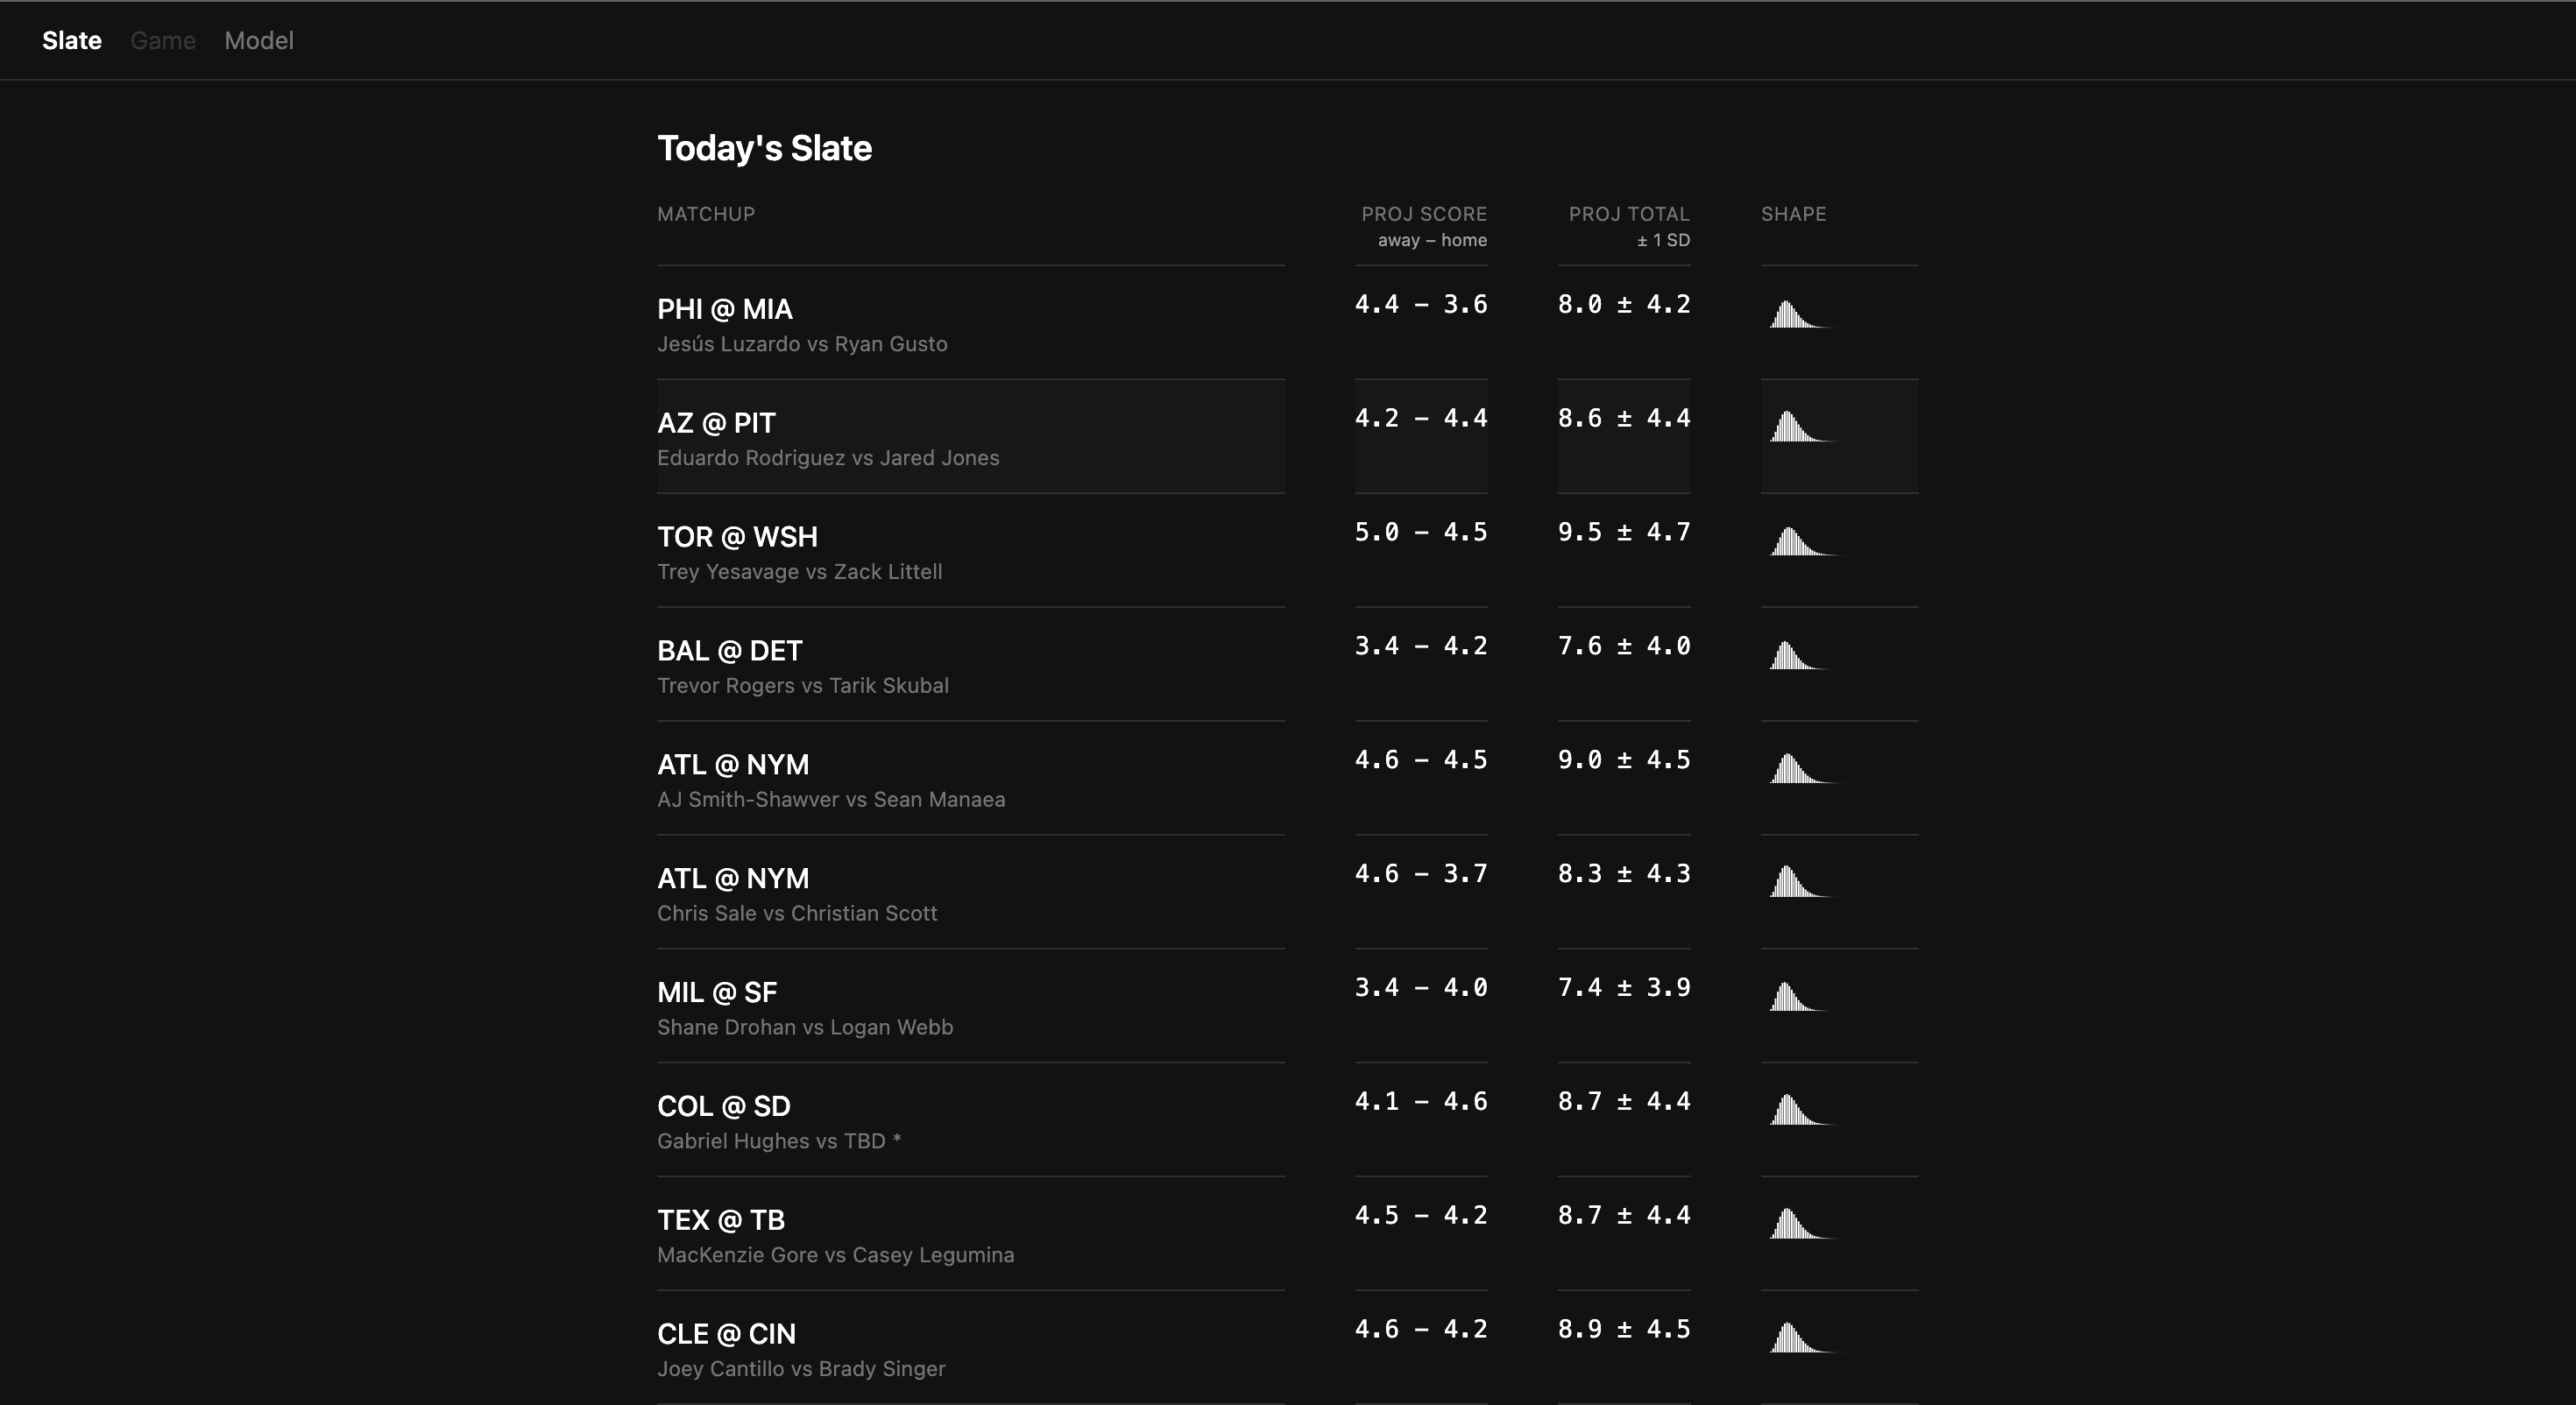
Some nights, the board looked fuller, closer to the 7.4-to-9.5 spread you saw above. But on plenty of others, every game clustered near the same total: 8.3, 8.7, 9.0, 8.8. Meanwhile a sportsbook posts totals from 6.5 to 11.5 basically every day. Averaged out, my model looked timid, like it was hedging toward league average and never committing to a genuinely high- or low-scoring game.
Obvious fix, right? Loosen it up. Trust the team stats more, pull toward the average less, let the extreme games be extreme.
I built the test to do exactly that: widen the predictions, but only where doing so actually improved the model's honesty (its calibration), so I couldn't just fool myself into confident garbage.
The result blindsided me. Widening the predictions made the model worse. And the home-run component, one of the inputs I was sure needed more freedom, wanted the exact opposite. It asked to be trusted less, not more. (Home runs are rare and lumpy; a few flukey ones in a small sample lie to you, so leaning away from them is what earned the improvement.) When I combined every honest adjustment the data endorsed, the total spread of my predictions went down, not up.
My instinct was wrong, and the data said so in a way I couldn't argue with. The model wasn't too timid. It was about as spread-out as its inputs genuinely justified, and my urge to make it “bolder” was really an urge to make it lie more confidently.
That's the whole game, honestly. The discipline isn't building the model. It's refusing to juice it toward output that looks impressive.
Hitting the wall, and proving it was a wall
So I ran the honest test. Train on 2023–2025, then predict a season the model had never seen: 2026. And crucially, split by time, never randomly, because a random split would let the model study August to predict July, leaking season-level information and inflating the score. (Same sin as before, wearing a different hat.)
The verdict: against the naive version of itself, my model won clearly, proof the whole machine works. But against the dumbest possible baseline, just guess the league-average total every single game, it was a statistical tie.
- GLM, off_woba (selected)−2.8775
- Flat league-mean baseline−2.8782
- Naive ratio baseline−3.4482
Totals-level log score on the 1,569-game 2026 holdout, where less negative is better. The gap to the flat baseline is 0.0007, on a scale where that's noise, not signal. The gap to the naive baseline is real and isn't close.
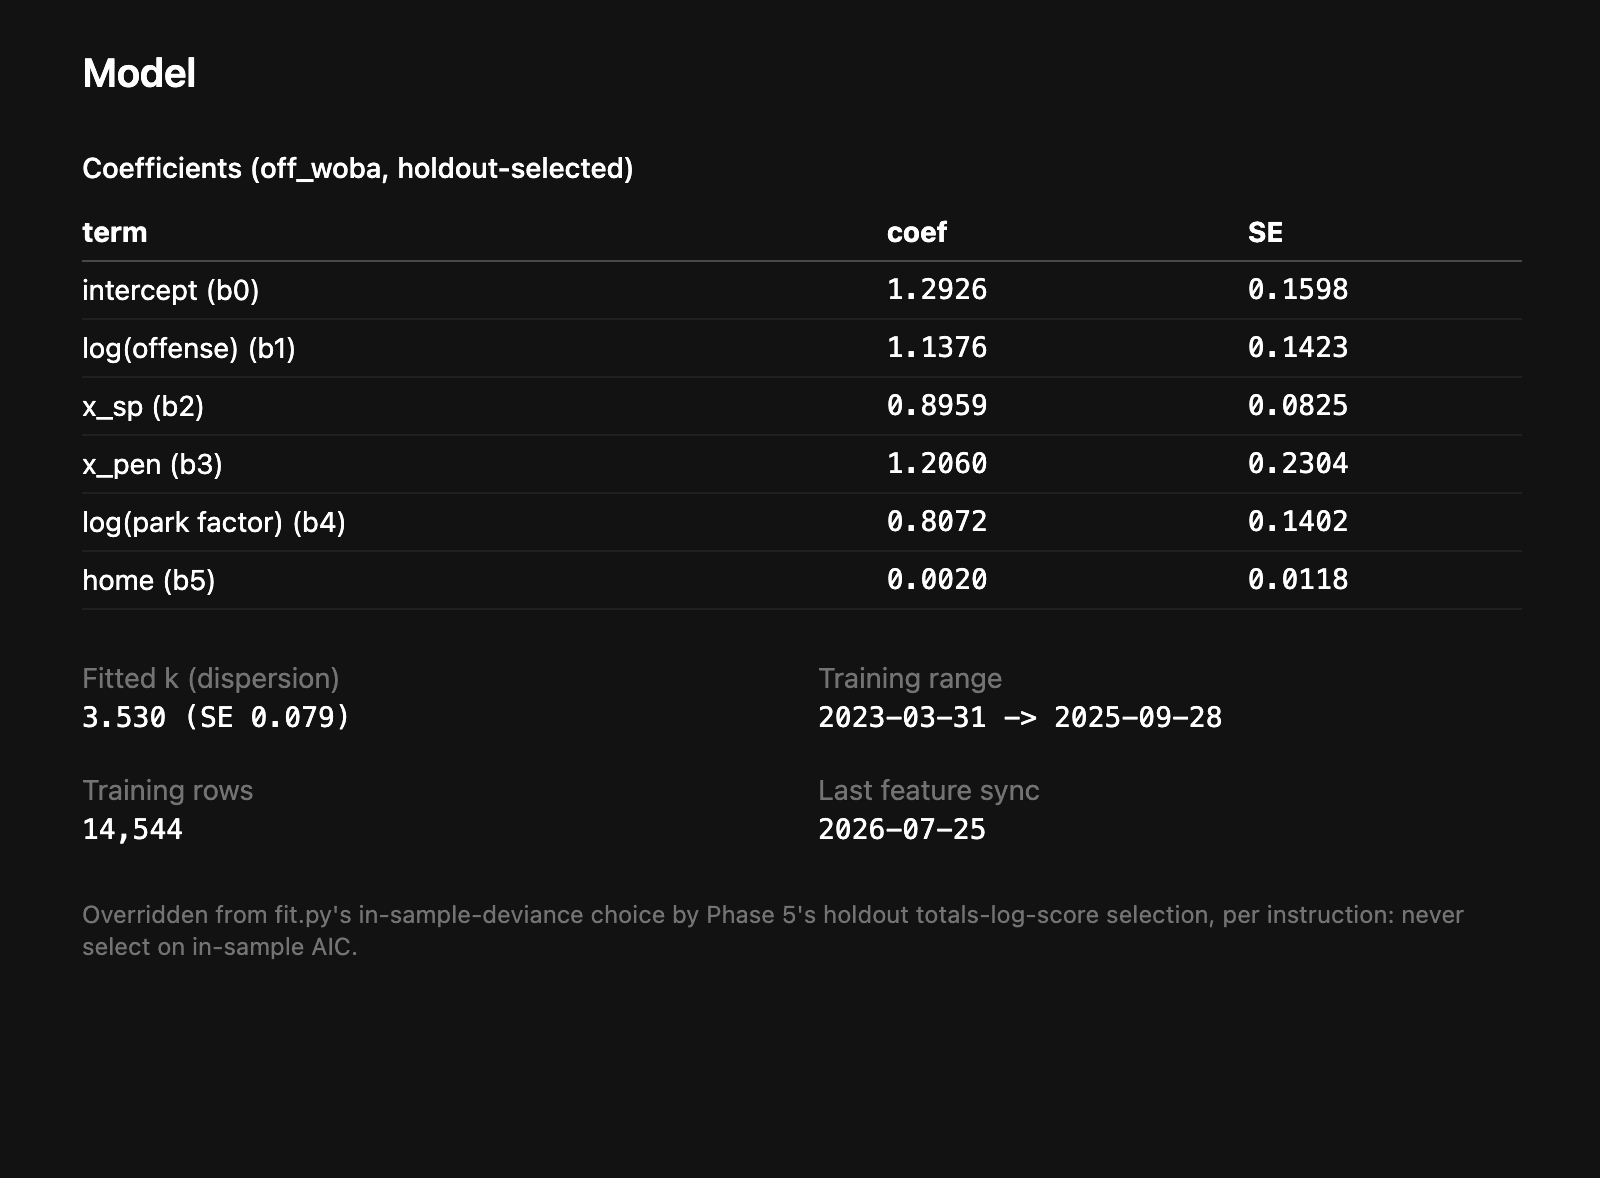
I ran the diagnostics every way I could. They all pointed at the same thing: my four features explain roughly 1% of the variance in game totals. Not because the model is broken, but because four team-level numbers are most of what a team-level model can possibly know, and that's near the ~9% ceiling I'd calculated on day one, further eroded by the noise in estimating those numbers from limited games. You can see it in the offense coefficient itself: 1.14, when clean theory says a perfectly-measured offense signal should land somewhere around 1.8–2.3. The model isn't ignoring offense. It's telling you that the offense number it has, estimated from a couple months of games, is too noisy to trust much further than that.
The model didn't fail to reach its ceiling. It reached its ceiling and confirmed the ceiling was real.
What would actually work (and why I haven't built it yet)
The gap between me and the sportsbook isn't math I got wrong. It's information I don't have.
The book prices things my four features are structurally blind to:
- Today's actual lineup: who's playing, who's resting, who got called up. I used team-level averages; they use the nine hitters actually in the box tonight.
- Weather: wind at Wrigley moves totals more than most stats people track. A windblown afternoon genuinely projects to 13 runs, and no amount of tuning my existing features gets there, because the wind simply isn't in them.
- Umpire: strike-zone tendencies shift run environments by real margins.
- Bullpen availability: a great bullpen that threw 40 pitches last night is not a great bullpen tonight.
Those are where the real extreme games live. That's the sequel. I didn't build it yet because live lineups, weather, and umpire assignments all mean new live data feeds instead of the cached, leakage-safe pipeline I already trust, and I'd rather ship the honest version now and add that surface area for bugs deliberately, later, than rush it in before the plumbing was even proven.
So, did it make my money back?
No. It told me, with clean math and no excuses, that beating a baseball total with team-level data alone is close to impossible, and it showed me precisely where the missing information lives.
That's worth more than the bets were. I'd probably do it again anyway, next time with a weather feed.
A few more things, if you want them:
- Codehttps://github.com/dkyxhjj/mlb_predictor ↗
- Live dashboardhttps://mlb-predictor.pages.dev/ ↗
- Argue with me about the home-run termrichardli.060411@gmail.com ↗
Built with Python, statsmodels, and pybaseball for the model; Vite, React, TypeScript, and Tailwind for the dashboard, deployed on Cloudflare Pages.